
Fall! It’s one of my favorite times ever. The windy energy of flying leaves, the downpours followed by brilliant rainbows, the air that feels electric and the colors that seem so vibrant after the dull heat of summer… it makes me want to ride and ride and ride.
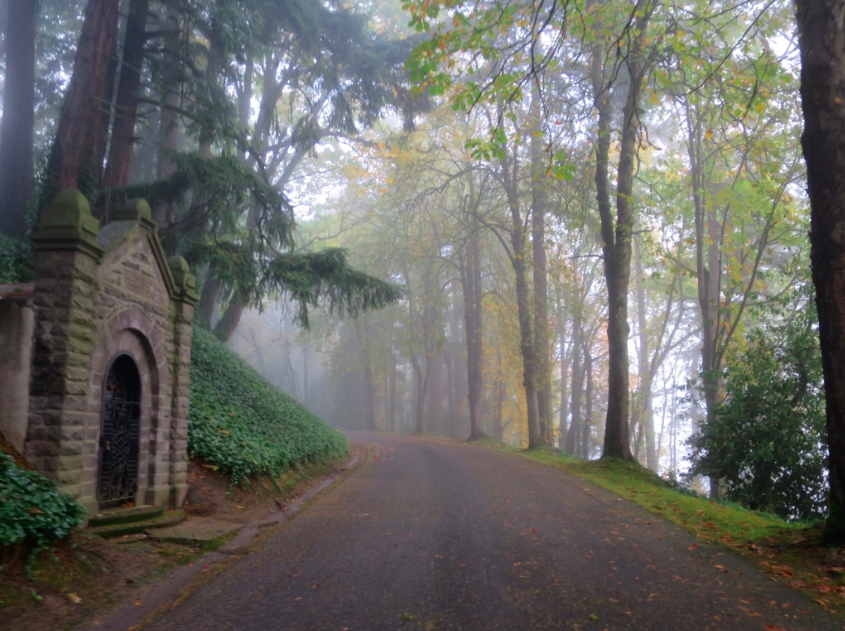 (who can argue with foggy fall colors?:)
It also means that the world starts getting much darker — back to the time where the people I see every morning become recognizable only by their headlamp placement or flashing pattern, or, if they’re any of the very few people who say good morning as we pass, their voices.
It’s also the time where people on the path become much fewer and far between: the diehard cyclists, runners, and walkers who come out despite the dark or the shitty weather.
A fellow I see sometimes biking to work on the Springwater — we’ll call him Jamie — has been tracking these ebbs and flows of cyclists on the path since 2009. It’s not a humongously rigorous study or anything, but every time he rides, he counts the number of other cyclists he sees, and keeps track. For nine years running. I asked him to share his data with me because I was curious, and he graciously sent me all his spreadsheets.
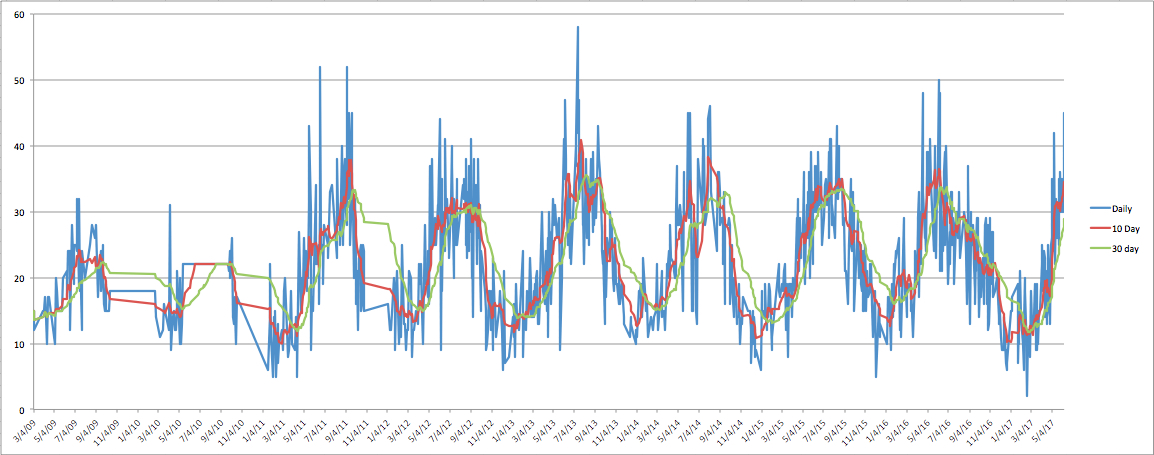
This is just the overview graph he sent, aggregating all the bazillion cells of data. For the most general of ideas, look at the green line: that’s the 30-day average that helps smooth out the ups and downs of the day-to-day (the blue line) into a more general trend.
It’s been about 5 months now since he originally sent this and I’ve intended to write about it, but the data still stands (just with the last five months missing;). It shows me what I intuitively feel: that ridership spikes in the summer months, and dips way, way low from December to February, the dreariest, rainiest, windiest, coldest, and shittiest of all months. The months where you’ve really gotta love it to throw yourself out into the wilds.
What I really love about this graph and all the data behind it, though, is the fact that it comes from a normal dude just being curious about something in the world, and keeping track for long enough to turn it into something meaningful. How many times have I thought “huh! It sure feels empty on the bike paths these days!” but then let it slip from my mind. You’ve got to respect someone who thinks “huh! It sure feels empty! I wonder how many people are actually biking?” and then, for nine years, every day, actually keeps track.
So thanks to Jamie for his informal record-keeping and for being willing to share his data. If you’re curious for more, perhaps he can chime in with any additions. In the meantime, enjoy these precious beautiful fall days, and smile at your fellow cyclists, even if you can only see their blinding headlamps;)
This is AWESOME! I love this info. Go Jamie!
Right?? In a sec I’m going to post the updated info he just sent me — stay tuned:)